Many budding internet marketers who start out building a list via solo ads, funnel clicks & through clickbanking get really excited.
They quickly build & toss up a simple funnel and proceed to drive traffic mostly through the above mentioned methods and hope for the very best in terms of leads & income / sales generated.
While they are indeed a big step ahead of those who do not take any action at all and while they may have a tracker built into their funnel, they are not fully sure how to understand & interpret the results and tweak their funnel for better performance.
What follows is my attempt to share 2 back to back days of stats from 1 single funnel (with very minute changes between both days) and hopefully share a thing or two which you can apply profitably in your own case.
DO NOTE it’s not meant to be exhaustive, pertains to the way I’ve structured my funnel at that point in time and does not specifically cover front end offers, up-sells, follow up series, broadcasts though the principles therein WILL CERTAINLY ASSIST you optimize these areas.
With that said, let’s get started! =) (WARNING: My sharing is relatively lengthy but I encourage you to understand it BECAUSE chances are, it’s going to yield you so much insight and ways to improve your funnel!)
On the 1st chosen day of study, I’ve got the following stats:
40 unique clicks or visitors
19 opt-ins
47.5% squeeze page conversion
And here is my handwritten study of stats (yes, I love writing things out … had to blur out some other parts for privacy though):

Don’t worry if you can’t read my words. Basically I studied what every single visitor did when they landed on my squeeze page.
Did each opt-in? And after they opt-in, did they click on any link? If so, which ones?
Just to give you an example, you may see a line on the left that says:
1 UC, 1 A, 2 clicks (This means that for this particular visitor, he / she opted in (represented by A) and clicked on 2 clickbanking links.
If the visitor did not opt-in, it will simply show:
1 UC
And if it’s an exit click, it’s simply represented by:
1 exit (or 3 exits if the visitor clicked on 3 exit clicks)
Got it?
After summarizing the results for day 1, I had…
40 UCs => 19 opt-ins (47.5% CR)
Of the 21 who did not opt-in, a total of 7 exit clicks were recorded
Of the 19 who DID opt-in, 7 clicked nothing (36.8%)
And of the remaining 12 that did, only 2 (yes, ONLY 2!) clicked on the link to download the free pdf report which was linked on the download page which the subscribers had to open the 1st email (a.k.a. Welcome email) and click on the link to access.
Just for clarity…
Opt-in => Check and open 1st welcome email => Click on link to access download page => Click on link to download free pdf report
Coming back to the results, of the 10 (i.e. 12 minus 2) that clicked on something apart from the pdf download link, a total of 24 clicks were clocked.
With that, here were my improvement points…
*Exit funnel needs to be optimized (Currently only 1 action per 3 non opt-ins. I.e. 21 divided by 7)
*36.8% of those just opted in did … ABSOLUTELY NOTHING! (ASK: What can I tweak to encourage engagement? Should I redirect?)
*Only 10.5% (i.e. 2 divided by 19) of those who opted in ACTUALLY went to download the report promised. (Therefore, for those who are paranoid about wanting to perfect their freebie, rest easy … most people are so distracted & lazy they’ll not get round to it)
=> ASK: What happened to the 89.5%? Got distracted? How to improve?
*Within this time period, 10 of the 19 opted in clocked a total of 24 clickbanking or exit clicks. (I.e. An average of 2.4 clicks per person … how to improve?)
Moving on to the 2nd chosen day of study, I’ve got:
115 unique clicks or visitors
52 opt-ins
45.2% squeeze page conversion
Again, here is my handwritten study of it (blurred out parts for privacy):
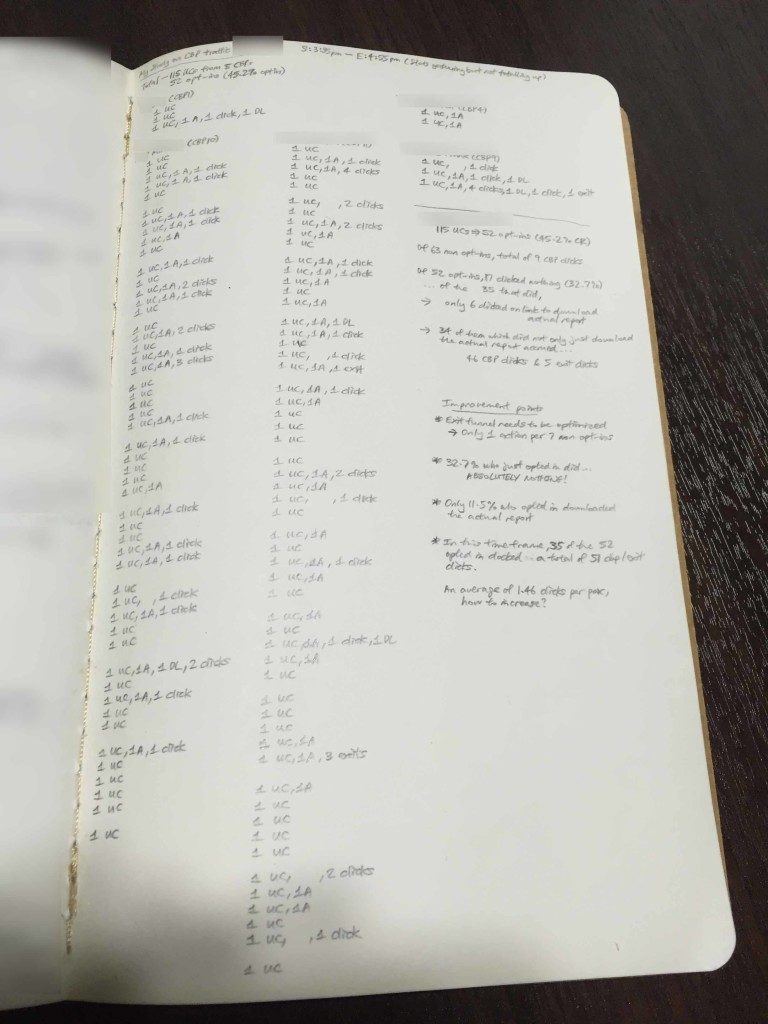
Same legends as before.
And oh, if there’s a 1 DL, it means that subscriber downloaded the free pdf report.
After summarizing the results for day 2, I had…
115 UCs => 52 opt-ins (45.2% CR)
Of the 63 who did not opt-in, a total of 9 clickbanking clicks were recorded
Of the 52 who DID opt-in, 17 clicked nothing (32.7%)
And of the remaining 35 that did, only 6 clicked on the link to download the free pdf report.
34 of the 35 who did not ONLY just download the pdf report (i.e. only 1 clicked to download the report and did not click anything else) clocked a total of 51 clicks.
And here were my improvement points…
*Exit funnel needs to be optimized (Only 1 action per 7 non opt-ins. I.e. 63 divided by 9)
*32.7% of those just opted in did … ABSOLUTELY NOTHING!
*Only 11.5% (i.e. 6 divided by 52) of those who opted in ACTUALLY went to download the report promised.
*Within this time period, 35 of the 52 opted in clocked a total of 51 clickbanking or exit clicks.
And here’s an OVERALL summary of those 2 days…
Total of 19 exit clicks => 5 converting clicks => $7 revenue (Therefore, a minimum of $0.36 – $0.41 EPC)
Total UCs – 155
Total opt-ins – 71 (45.8%)
Total non opt-ins – 84 (54.2%)
=> Recorded 16 clickbanking or exit clicks … 1 click action per 5.25 non opt-ins)
Of the 71 opt-ins, 24 clicked nothing (33.8%)
… Of the 47 that did:
=> 8 clicked on link to download report (Therefore, only 11.2% of opted in went to download report)
=> 75 clickbanking or exit clicks were accrued (Therefore, an average of 1.6 clickbanking or exit clicks per sub clocked … mostly (if not all) within 60 minutes of opting in)
Hopefully this hasn’t been too technical for you.
So with all that said and done … What are some things you can do to improve your funnel?
First things first, analyze your traffic. You can’t improve what you haven’t measured … And thereafter…
1) Boost your squeeze page conversion (Need I say this? Test design, offer, headline and other elements)
2) Optimize & monetize your exit traffic (For many marketers, there’s more traffic going away than opting in. All wasted traffic unless you engage them. See suggestions below)
3) Stimulate engagement upon opting in (Perhaps use a video? Change headlines? Swap offers? Test pricings? Redirect?)
4) Encourage your subscriber to actually download or consume your high quality freebie (Perhaps they prefer audio / video? TEST IT!)
5) Consider setting a cookie on your squeeze page as traffic from people who have already recently seen your offer & rejected it won’t go wasted. (Can auto redirect to another page, offer, clickbanking partner, etc)
6) If you’re using Aweber, send all meta_onlist_redirect links to another page, offer, clickbanking partner (Am sure you can do this with other major autoresponder platforms)
7) Outsource certain parts of your funnel (e.g. Lead collection or tracking) to external services (Especially if you’re using a slow webhosting account. Don’t allow this to be your bottleneck as it simply doesn’t make sense to invest $500 into paid traffic only to be hampered by a $10 per month hosting account)
8) Improve your open & click rates … Too much to share and will leave that to a video presentation I’ll be creating soon! =)
In closing, can you now see just how important it is to optimize your funnel before you open the floodgates and drive traffic in?
Wanna encourage you to tread slowly in the beginning while you “dial up” your funnel.
And by the way, it won’t take too much of your time in the beginning to gather and study your stats (it took me under 2 hours to do so for my day 2).
It just takes a genuine desire to improve as a marketer.
Besides, it’s a highly profitable activity, isn’t it?
If you delay this, it’s going to be tougher down the road to analyze results.
Finally, thank YOU for taking the time to read the above profitably!
P.S. I PERSONALLY use and recommend ClickMagick as my tracker and rotator!